Navigation Map
- strategy (insurance, health, investments, finances);
- sustainable development (sales, employees, social responsibility, natural environment and ethics).
PRACTICES
In the Chapter
GRIs
In the Chapter
GRIs
In the Chapter
List of GRIs
In the Chapter
GRIs
In the Chapter
GRIs
In the Chapter
GRIs
In the Chapter
GRIs
In the Chapter
GRIs
In the Chapter
GRIs
In the Chapter
GRIs
In the Chapter
Operating model
GRIs
- About the report
- Results
- Comment on the financial results for 2020
- Major factors contributing to the consolidated financial result
- PZU Group’s income
- PZU Group’s claims paid and technical provisions
- PZU Group’s acquisition and administrative expenses
- Drivers and atypical events affecting the results
- PZU Group’s asset and liability structure
- Contribution made by the market segments to the consolidated result
- Issuer’s financial results – PZU (PAS)
- Impact of the COVID-19 pandemic on the PZU Group’s results
- Business strategy (2017-2020)
- CSR strategy(2017-2020)
- Supplementary information and notes
- 1. Introduction
- 2. Composition of PZU Group
- 3. Shareholder structure
- 4. Composition of the Management Board, Supervisory Board and PZU Group Directors
- 5. Key accounting policies, key estimates and judgments
- 5.1 Impact of the COVID-19 pandemic on the estimates and assumptions
- 5.2 Changes in accounting policies and estimates, errors from previous years
- 5.3 Amendments to the applied IFRS
- 5.4 Explanation of differences between the 2019 annual consolidated financial statements and these consolidated financial statements
- 5.5 Consolidation principles
- 5.6 Measurement of transactions and balances denominated in foreign currencies and FX rates used
- 5.7 Purchase method
- 5.8 Classification of insurance contracts in accordance with IFRS 4
- 6. Segment reporting
- 7. Risk management
- 8. Equity management
- 9. Fair value
- 10. Gross written premium
- 11. Fee and commission income
- 12. Interest income calculated using the effective interest rate
- 13. Other net investment income
- 14. Result on derecognition of financial instruments and investments
- 15. Movement in allowances for expected credit losses and impairment losses on financial instruments
- 16. Net movement in fair value of assets and liabilities measured at fair value
- 17. Other operating income
- 18. Claims and movement in technical provisions
- 19. Fee and commission expense
- 20. Interest expenses
- 21. Acquisition costs
- 22. Administrative expenses
- 23. Employee expenses
- 24. Other operating expenses
- 25. Income tax
- 26. Earnings per share
- 27. Goodwill
- 28. Intangible assets
- 29. Other assets
- 30. Deferred acquisition cost
- 31. Property, plant and equipment
- 32. Investment property
- 33. Entities carried by the equity method
- 34. Loan receivables from clients
- 35. Financial derivatives
- 36. Investment financial assets
- 37. Receivables
- 38. Impairment of financial assets
- 39.Cash and cash equivalents
- 40. Equity attributable to equity holders of the parent
- 41. Technical provisions
- 42. Subordinated liabilities
- 43. Liabilities on the issue of own debt securities
- 44. Liabilities to banks
- 45. Liabilities to clients under deposits
- 46. Other liabilities
- 47. Provisions
- 48. Deferred income tax
- 49. Assets and liabilities held for sale
- 50. Lease
- 51. Assets securing receivables, liabilities and contingent liabilities
- 52. Contingent assets and liabilities
- 53. Offsetting financial assets and financial liabilities
- 54. Notes to the consolidated cash flow statement
- 55. Disputes
- 56. Transactions with related entities
- 57. Headcount
- 58. Other information
- Financial data (2019-2020)
- Financial data (2016-2020) Focus on: Results - check the highlights of the year!
- Comment on the financial results for 2020
- Market and business
- External environment
- Business model
- Structure of the Group
- Operating model
- Brand management
- Insurance
- Non-life insurance (PZU, LINK4 and TUW PZUW)
- Life insurance (PZU Życie)
- Insurance (international operations)
- Investments
- Investments (PZU TFI)
- Investments (PTE PZU)
- Health
- Health (health companies)
- Banking and strategic partnerships
- Banking (Bank Pekao, Alior Bank)
- Other operating areas
Focus on: Market and business - check the highlights of the year!
- Capitals (IIRC)
- Strategy and outlook 2021+
- Risk and ethics
- Objective of risk management
- Risk management system
- Risk appetite
- Risk management process
- PZU Group's risk profile
- ESG risks
- Risk vulnerability
- Reinsurance operations
- Capital management
- Ethical foundations of doing business
- Preventing corruption and conflicts of interest
- Whistleblowing System
- Transaction security
- Tax transparency
- Cooperation with suppliers Focus on: Risk and ethics - check the highlights of the year!
- Corporate governance
- Application of corporate governance rules
- System of control in the process of preparing financial statements
- Audit firm auditing the financial statements
- PZU's share capital and its shareholders
- Rules for amending the Company's Articles of Association
- Shareholder Meeting and shareholder rights
- Supervisory Board and Management Board
- Compensation paid to members of supervisory and management bodies
- Diversity policy Focus on: Corporate governance - check the highlights of the year!
- Shares and bonds
- Equity and bond market
- PZU's share price
- Banking sector on the Warsaw Stock Exchange
- PZU's investor relations
- Analysts' recommendations regarding PZU's shares
- PZU Group's Capital and Dividend Policy
- Debt financing of PZU, Bank Pekao and Alior Bank
- Rating
- Calendar of PZU's major corporate events in 2021 Focus on: Shares and bonds - check the highlights of the year!
Polish and Baltic States insurance sector compared to Europe

Insurers running their businesses in European Union countries collected EUR 1,047 billion in premiums in 2019. This accounts for approx. 18.6% of the world’s gross written premium1.
Concerns regarding the more pronounced global slowdown in economic growth, commercial tensions and the risk of persistently low interest rates, especially for life insurers appeared on the insurance market in 2019. The topic of climate change and the losses it will generate for society and the economy showed up in discussions. Insurers faced challenges such as the technological transformation of the insurance markets, cybersecurity and data security, as well as the growing significance of ESG factors. Despite the detection of the first case of the SARS-CoV-2 coronavirus infection on 17 November 2019 in the city of Wuhan in the Hubei province in central China, nobody had imagined the consequences the COVID-19 pandemic would evince for the functioning of the global economy and the global financial markets.
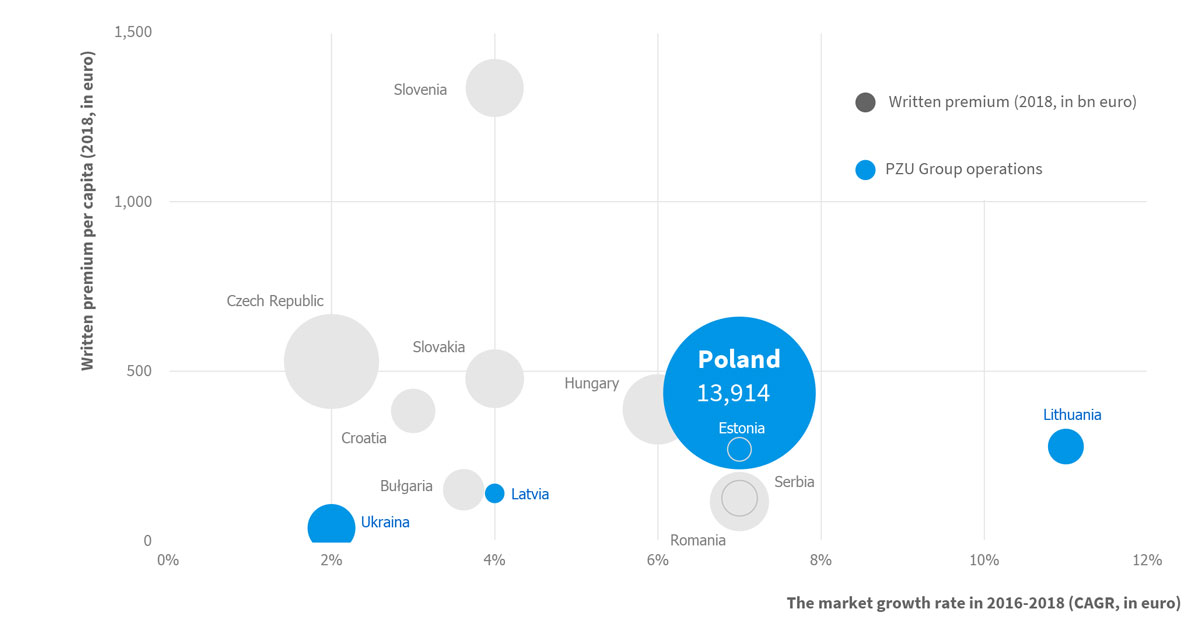
In 2020 the statistical European spent EUR 1,997 on insurance2. A year earlier, it was EUR 1,9583. In 2018, the average Pole spent EUR 436, or more than 4 times less. Insurance spending in the Baltic states was even lower. In 2018, the average Lithuanian spent EUR 278 on insurance, the average Estonian spent EUR 270 and the average Latvian spent EUR 140. In 2018, the average Ukrainian spent only EUR 384 on insurance.
In Poland, the market insurance model has been developing since 1990. At present, Poland has the largest insurance market in Central and Eastern Europe. However, even though the size of this market (as measured by gross written premium) more than doubled between 2009 and 2018, it still remains way behind Western Europe. In 2018, total gross written premium in the Polish market was EUR 13.9 billion (compared to EUR 6.8 billion in 2009)5. In 2019, it was converted into EUR 13.8 billion6.
Europe’s largest insurance market is the United Kingdom (with EUR 327.2 billion in gross written premium in 2019). Markets above the EUR 100 billion gross written premium threshold include France (EUR 234.3 billion), Germany (EUR 217.9 billion) and Italy (EUR 150.0 billion). In terms of size, the Polish insurance market also trails behind certain Western European countries with a significantly smaller population than Poland, including Austria (EUR 17.6 billion), Belgium (EUR 32.5 billion), Denmark (EUR 33.2 billion), Finland (EUR 24.4 billion), the Netherlands (EUR 74.7 billion), Switzerland (EUR 52.7 billion) and Sweden (EUR 34.3 billion)7.
The structure of the Polish market is dominated by non-life insurance (approx. 67% of the market), with the majority of gross written premium generated by motor insurance. In 2019, gross written premium collected on motor third party liability insurance and motor own damage insurance accounted for 39% of the entire market’s gross written premium8. The share of life insurance in Poland’s total gross written premium (33%) was, in turn, a third lower than the average for West European markets. A similar structure of insurance markets is typical of the Baltic states. In those countries, life insurance, on average, accounts for approx. 25% of total gross written premium9.
This situation is completely different from that of West European countries where life insurance takes the bigger chunk of the market. Countries with the most developed life insurance market are countries that also have the largest insurance markets. These include Italy (in 2019, life insurance accounted for 74.0% of gross written premium), the United Kingdom (72.1%), France (63.9%) and the Scandinavian states: Finland (81.6%), Sweden (74.6%) and Denmark (74.5%)10.
Gross written premium per capita (2018, EUR) in relation to the insurance market growth rate (2016-2018, EUR)

Source: own study based on Eurostat, Insurance Europe, Swiss Re Institute
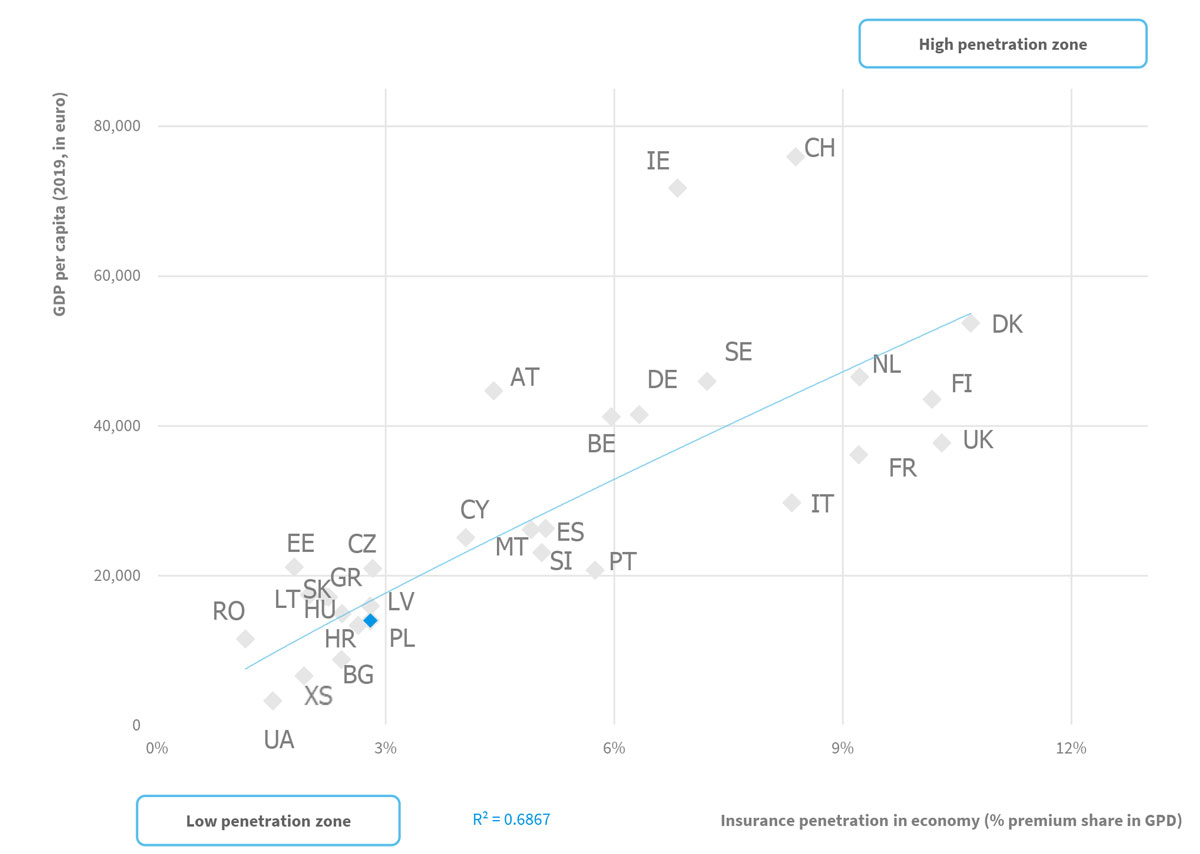
Poland’s insurance penetration rate, which is the ratio of total gross written premium to gross domestic product (GDP), is below the European average. In 2019, this rate stood at 2.8%, whereas the Europe average was 4.8%. Even lower penetration rates were achieved in the insurance markets of Lithuania (2.0%), Latvia (2.8%), Estonia (1.8%) and Ukraine (1.5%). The highest penetration rates were recorded by the United Kingdom (10.3%), Denmark (10.7%), Finland (10.2%) as well as the Netherlands (9.2%)11.
Analyzing the penetration of insurance in relation to GDP per capita, it should be expected that the Polish insurance sector will develop alongside Poland’s economic development (growing GDP), greater affluence of the society (increasing disposable household incomes) and growing insurance awareness of the local population, which was exactly the path taken by West European countries.
Penetration of insurance in relation to GDP per capita in Europe (2019, EUR)

Source: own study based on Eurostat, Swiss Re Institute, Deloitte
1 2 Swiss Re, sigma 4/2020: World insurance: riding out the 2020 pandemic
3 4 5 Insurance Europe, https://insuranceeurope.eu/insurancedata
6 KNF, Annual bulletin. Insurance market 2019, updated on 6 November 2020
7 Swiss Re, sigma 4/2020: World insurance: riding out the 2020 pandemic
8 KNF, Annual bulletin. Insurance market 2019, updated on 6 November 2020
9 Deloitte, CEE Insurance M&A Outlook, data aktualizacji październik 2019
10 11 Swiss Re, sigma 4/2020: World insurance: riding out the 2020 pandemic
Investor Relations Team
e-mail: IR@pzu.pl
Magdalena Komaracka, IR Director, tel. +48 (22) 582 22 93
Piotr Wiśniewski, IR Manager, tel. +48 (22) 582 26 23
Aleksandra Jakima-Moskwa, tel. +48 (22) 582 26 17
Aleksandra Dachowska, tel. +48 (22) 582 43 92
Piotr Wąsiewicz, tel. +48 (22) 582 41 95
