CEO and the Chairman introduce to the most important achievements of the year
Letter to Shareholders
Dear
Stakeholders,
The PZU Group is the largest financial institution in Central and Eastern Europe. We employ approximately 40 thousand employees in five countries: in Poland, Ukraine, Lithuania, Latvia and Estonia who enable us to serve roughly 22 million clients. Together we are building profitability and generating the highest solvency ratios among European insurers. We measure our success not only in terms of financial results but also social commitment, actions to benefit the natural environment and sustainable development.
Read allVIDEO: Results 2020 - webcast VIDEO: AGM 2020 - webcast

Dear
Shareholders,
The past year was a huge unknown for the entire economy. Uncertainty in businesses and households triggered by the avalanche-like spread of coronavirus and the enactment of business restrictions in many industries led to a marked decline in economic activity. The year of the pandemic meant many challenges for the PZU Group companies. Even though they were difficult to anticipate, they did not form an obstacle to development. Rather they served as a driving force to introduce more dynamic change. By taking this approach to business the PZU Group retained its strong position as the leader in financial services and the insurer crafted a new strategy for upcoming years.
Read allVIDEO: Results 2020 - webcast VIDEO: AGM 2020 - webcast
Dear Stakeholders,
The global coronavirus pandemic meant that 2020 required for business to demonstrate exceptionally effective management and efficient adjustment to new market conditions. The PZU Group utilized this time to grow dynamically while simultaneously maintaining a high level of safety in its business. It ended the year of the pandemic among the groups reporting the highest solvency ratios in the world. It discharged other obligations in addition to its business objectives. It accomplished an important social goal by getting involved in the fight against the COVID-19 pandemic.
Read all
PZU in numbers - see what we have accomplished and how we built the value of the PZU Group
PZU in numbers
Discover more
Financial
performance

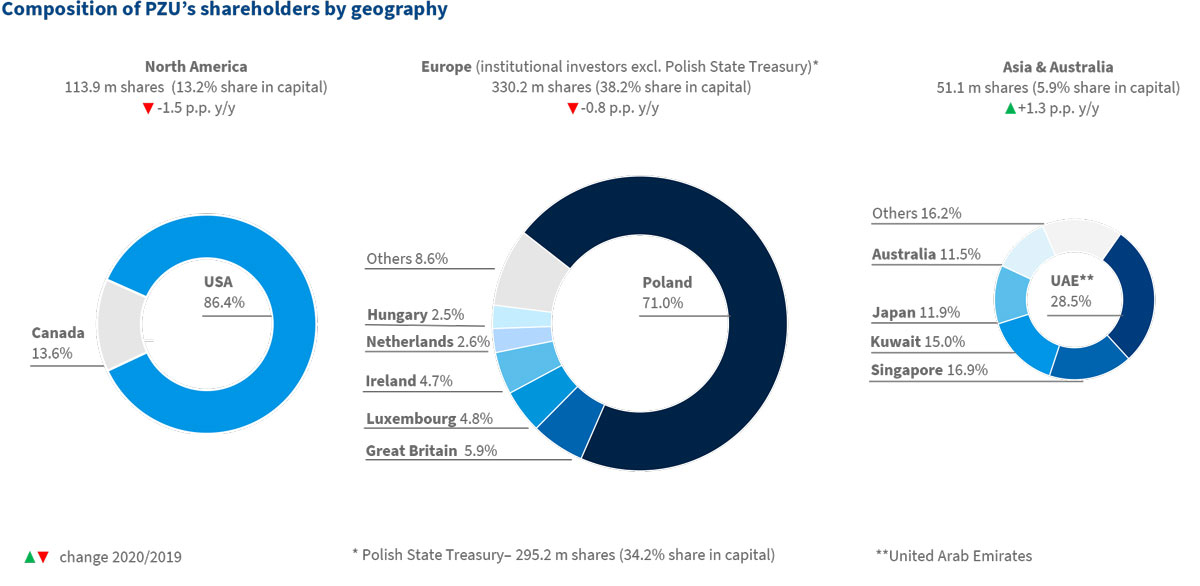
Share
performance

Sustainable
growth

Business
performance
Gross written premium and net profit of PZU since the IPO on the stock exchange
Sales and net profit 2010-2020
Discover more
net
profit
gross written
premium
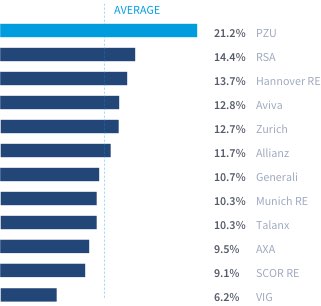
PZU Group’s ROE vs peers
ROE
Check out this interactive map.
See in which markets we are present in Europe.
We are leaders not only in Poland.
Market position
Discover morePoland
Estonia
Lithuania
Latvia
Ukraine
Meet the key groups of our stakeholders and see how we manage these relationships.
Stakeholders Map
Discover moreScroll to the right to see more
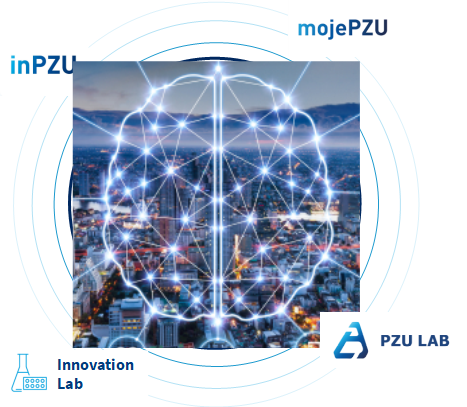
See the implementation of the #nowePZU strategy in 2020 and learn about the key elements of our new Strategy for 2021-2024.
Innovation Strategy
Discover more Play videoGROWTHAND DIVIDENDS
- Higher gross written premium on insurance activity + 9.9% to PLN 26 billion
-
Higher revenue in our health business + 80% to PLN 1.7 billion/
Leader position in asset management – higher AuM + 82% to PLN 60 billion - Leveraging the potential of the PZU Group’s banks – higher contribution of the PZU Group’s banks to the PZU Group’s financial net result + 648% to PLN 0.8 billion
- Maintaining cost effectiveness – 7% administrative expense ratio
- Ensuring a predictable and attractive model for generating shareholder value
SCALEAND SYNERGIES
- Strengthening benefits ensuing from the potential and scale of being the largest insurance and banking group in Central and Eastern Europe
- Giving clients a comprehensive product offering thanks to the synergies afforded by the PZU Group by taking advantage of various distribution channels
- Revolutionizing the approach to health care – comprehensive medical advice
- Developing business ecosystems for new and current clients
TECHNOLOGYAND DIGITALIZATION
- Digitalization and streamlining processes
- Utilization of AI, Big Data and advanced analytics
- Utilization of new digital distributions channels to supplement the traditional ones
- Implementation of cloud-based solutions
- Introduction of tools for estimating cybersecurity risk in the financial sector
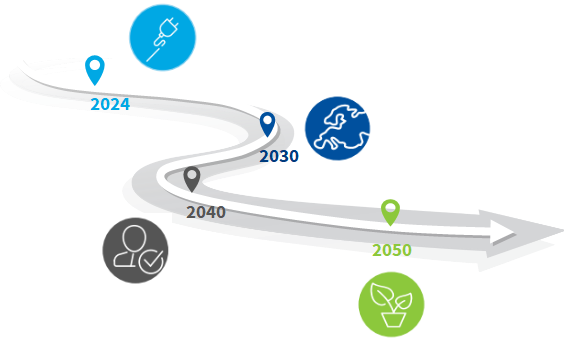
SUSTAINABLEDEVELOPMENT
- Achieving climate neutrality (scope 1 and 2) by 2024
- Increasing the exposure in investments supporting climate and energy transformation
- Developing our array of ESG insurance and investment products
- Including ESG criteria in procurement processes
- Including ESG targets among the strategic objectives of our companies and senior management
As a result in 2024 we will achieve:
- the highest net profit in PZU’s stock exchange history PLN 3.4 billion
- above average return on equity (ROE) 17.4%
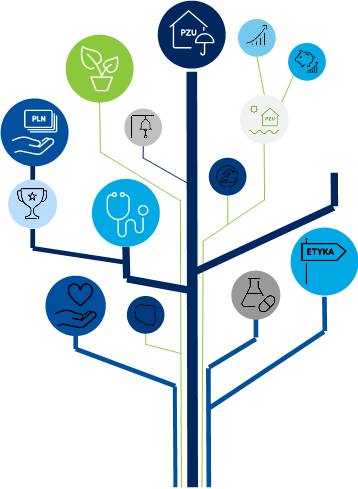
See how we manage capital, building value for our stakeholders.
Business: Value Creation Model
Discover moreCapital…
Financial capital – resource containing funds that arises by providing funding through loans or grants, or is generated through operating activity. These funds include shareholder funds, equity and external capital;
Intellectual capital – organization’s resource based on knowledge, experience, including among others intellectual property such as patents, copyrights, software, rights and licenses, the organization’s know how, motivation to improve and develop processes, leadership and cooperation and investments in new solutions and innovations facilitating development;
Infrastructural capital – physical objects used by the organization in the process of producing goods or rendering services (branches, centers) as well as the distribution network formed by agents, private persons conducting agency activity and other partners cooperating with the PZU Group;
Human capital – competences, know how, skills, experience and motivation of employees to develop and innovate, including the capacity of grasping and implementing the organization’s strategy;
Social and relational capital – reputation, earned trust and the quality of relations with clients, communities and other stakeholders;
Natural capital – renewable and unrenewable natural resources (including water, minerals and air as well as biodiversity and the protection of ecosystems) and processes whereby products or services are delivered
Business model
Insurance

Protection against the effects of events of chance – risk valuation, premium calculation and investment, payment of claims
Health
Health care – offering health insurance and medical care services, prophylactics, prevention, promoting a healthy lifestyle
Investments
Financial security protection – growing savings, capital accumulation programs
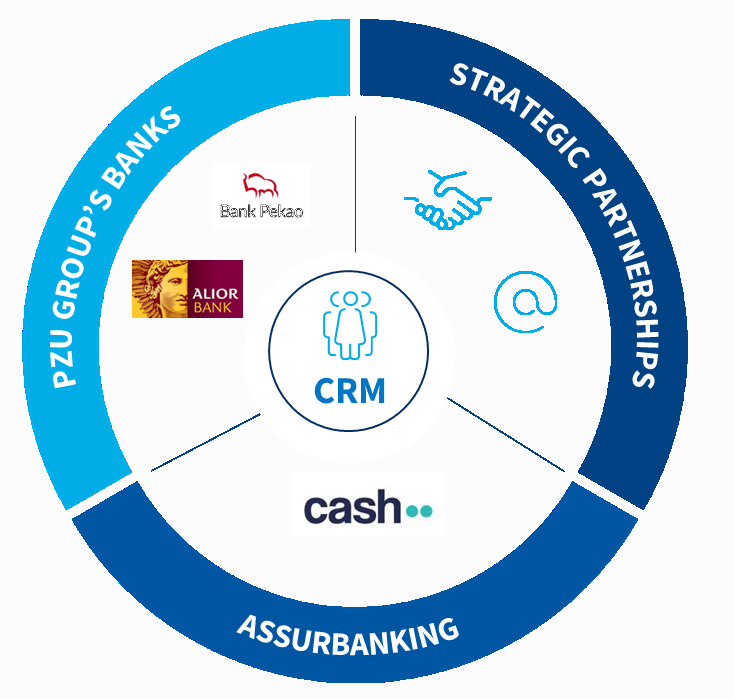
Banking and strategic partnerships
Conducting banking activities, including taking deposits, extending credits and loans, running bank accounts, handling cash settlements and rendering payment services