PZU's share price

PZU made its debut on the Warsaw Stock Exchange (WSE) on 12 May 2010. Since its floatation, it has been included in its most important index, namely WIG201, calculated on the basis of the portfolio value of the 20 largest and most heavily traded companies on WSE’s main market. PZU also belongs to the following Polish indices: WIG, WIG30, WIG-Poland, WIGdiv, WIG20TR, WIG.MS-FIN, CEEplus and WIG ESG (sustainable development index) and the following international indices: MSCI Poland (emerging markets), Stoxx Europe 600 (developed markets) and FTSE Russel mid-cap index (developed markets).
Warsaw Stock Exchange indices
In 2020, the Polish blue chip index (WIG20) oscillated in the broad range between 1,306 and 2,200 points. The variance between the extreme points of this range, which reached 894 points, was 527 points greater than that observed in the corresponding period of 2019 (367 points). In 2020, WIG20 declined by 7.7% y/y or, taking dividends into account, by 7.2% (WIG20 TR). The broad-market WIG index lost 1.4% y/y. The small-company sWIG index performed much better in this period (up 33.6%), having recorded a double-digit rate of return for the second consecutive year.
PZU’s share price
In 2020, PZU’s shares remained among the most liquid companies traded on the WSE. With a market capitalization of over PLN 27.9 billion at the end of 2020, PZU ranked as the fifth largest domestic company by market cap on the WSE. PZU’s share in WSE’s total trading volume was 5.9% (6th place).
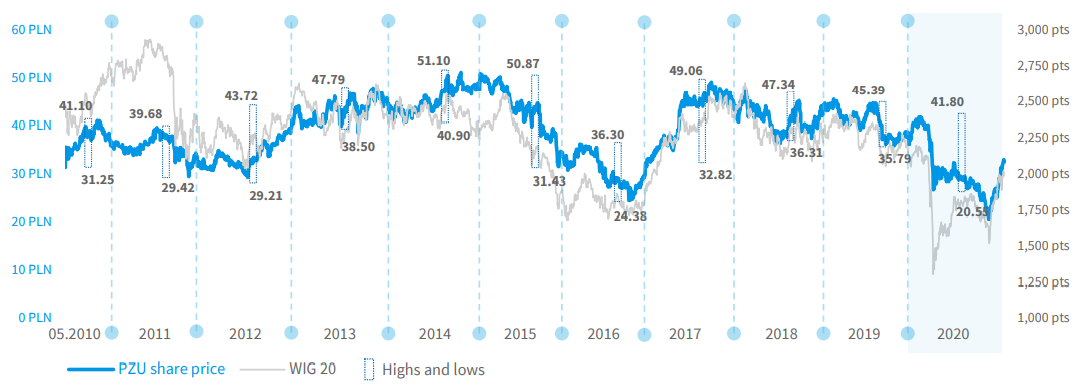
The maximum price per share of PZU stock in 2020 was PLN 41.80 (at closing prices) and the minimum price was PLN 20.55 – the lowest level in the history of PZU’s listing (without taking historical dividends into account). In 2019, these prices were PLN 45.39 and PLN 35.79, respectively.
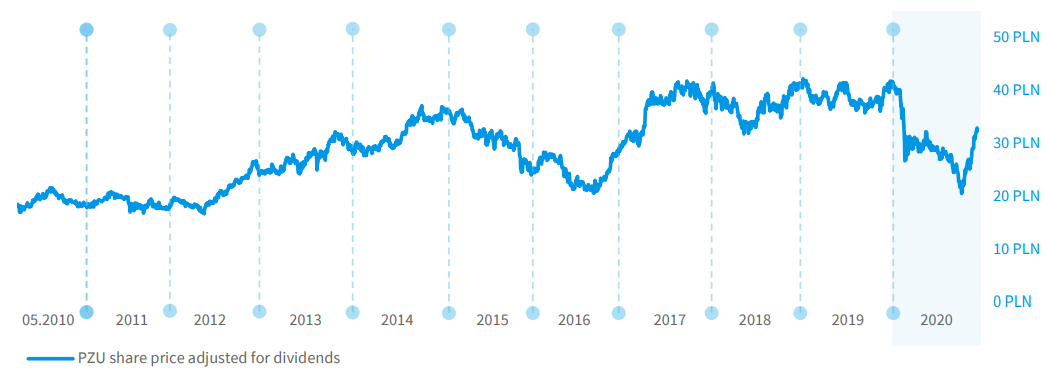
Taking dividend distributions2, into account, the drop in the share price was much less severe. The price trough of PLN 20.55 hit on 28 October 2020 was comparable to the bottom price of January 2016. In fact, its value was 23.5% greater than the historically recorded minimum price on PZU stock. Since PZU’s IPO (Initial Public Offering) in 2010, the cumulative value of dividend distributions per share has been PLN 26.1. As at the end of 2020, the total rate of return (calculated in accordance with this methodology) was 75.7%.
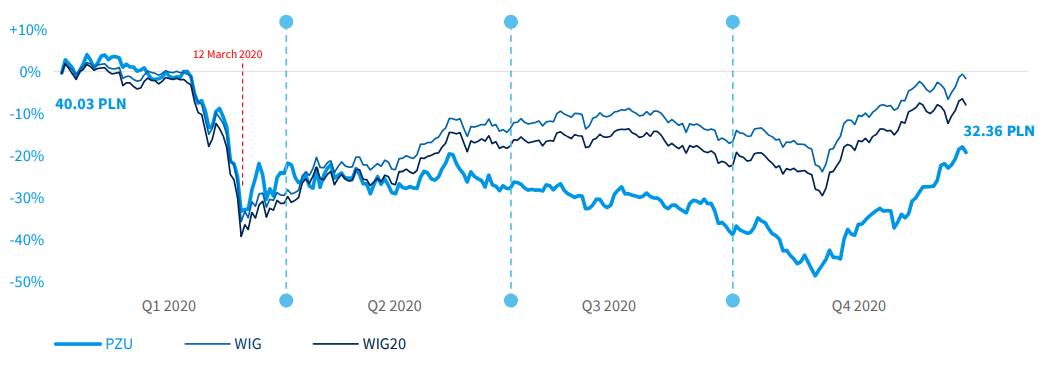
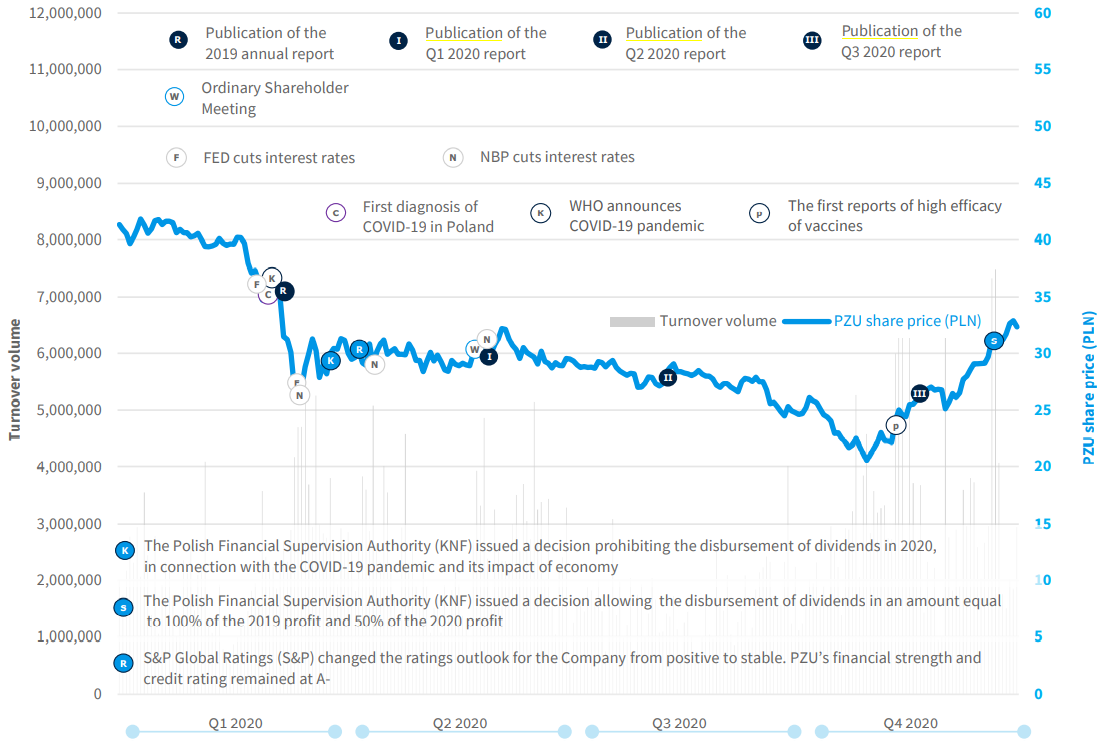
At the beginning of Q1 2020, the PZU stock prices went hand in hand with the main indices of the Warsaw Stock Exchange. The situation changed dramatically at the beginning of March, when the first individual in Poland was diagnosed with COVID-19. On the day following the announcement of a pandemic by the World Health Organization (WHO) on 11 March, the WIG and WIG20 indices tumbled 12.7% and 13.3%, respectively, while PZU dwindled 11.3%, thus recording the largest single-day drops in their history. From 5 to 12 March 2020, the accumulated decline in the price of PZU stock was 30%.
PZU’s min/max share price at session closing from May 2010 to 2020
Source: www.infostrefa.com, www.msci.com
PZU’s share price adjusted for dividends paid from May 2010 to 2020
Source: www.stooq.pl
The situation started to improve after 12 March. As was the case in global markets, local indices recovered most of their dips in Q2 2020. However, already in Q2 2020, the price of PZU’s stock began to underperform the benchmark WIG20 index. Among the factors that affected this outcome was the deterioration of macroeconomic conditions for the banking business. From March to May 2020, the NBP cut down its interest rates three times, bringing them down to almost 0%.
Moreover, on 26 March 2020, the Polish Financial Supervision Authority (KNF) issued a decision prohibiting the disbursement of dividends in 2020 by insurance companies and banks from their 2019 profits. This decision was triggered by the state of epidemic announced in Poland and its potential adverse impact on the country’s economy as well as the expected consequences for the banking and insurance sectors.
The situation changed very rapidly in Q4 2020. On 9 November 2020, news spread around the world that the US-based pharmaceutical company Pfizer, in collaboration with the German biotechnology company BioNTech SE, confirmed the more than 90% efficacy of their proprietary vaccine against the SARS-CoV-2 coronavirus. Global indices reacted to the news favorably. By the end of 2020, the price of PZU’s stock increased 57.5% compared to its annual low of PLN 20.55. During the last stock exchange session held in 2020, the price per PZU share was PLN 32.36.
PZU stock price versus WIG and WIG20
Source: www.gpwinfostrefa.pl
NBP reference rate

Source: www.nbp.pl
Factors affecting PZU’s stock price in 2020
Source: www.gpwinfostrefa.pl
QR codes (video links)

Source: Company
Liquidity
In 2020, PZU’s shares were highly liquid. The average daily spread of PZU’s stock was 9 bps compared to the average spread of 22 bps for the 20 most liquid companies. The average daily trading volume of PZU’s stock in 2020 was 2.4 million shares (up 43.2% y/y). The total annual trading value was in excess of PLN 17.6 billion.
The largest daily trading volume was recorded during the bullish sessions of 17 December (7.3 million shares, up 4.8%) and 18 December 2020 (7.5 million shares, up 0.5%). These large trading volumes were likely driven by KNF’s publication of a stance on the lifting of the ban on dividend distributions by insurers. Following the 16 December 2020 session, KNF announced that insurers will be permitted to disburse dividends in an amount equal to 100% of the 2019 profit and 50% of the 2020 profit, provided that certain quality and capital criteria have been fulfilled.
Volatility
Compared to the broad WIG market, PZU’s systematic risk expressed by the beta coefficient (PZU share price versus the WIG index for daily changes) was 0.99 in 2020 (0.86 in 2019). The annualized standard deviation (calculated on daily changes) in the PZU share price increased by 18.7 percentage points to 38.7%. The corresponding values for WIG and WIG20 also swelled significantly – by 17.1 percentage points to 29.8% and by 15.7 percentage points to 32.7%, respectively. The decline in capitalization which was not accompanied by a corresponding decline in liquidity translated into a material increase in the trading volume.
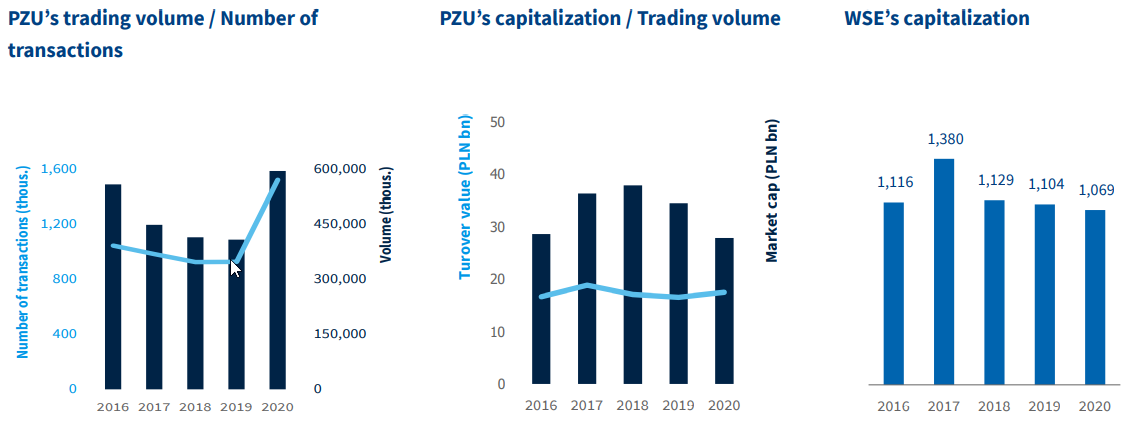
Source: www.gpwinfostrefa.pl, Company
Statistics concerning the PZU share price adjusted for dividends paid
| Statistics concerning the PZU share price adjusted for dividends paid |
2016 | 2017 | 2018 | 2019 | 2020 |
| Closing price on the last trading session of the year (PLN) | 52,59 | 62.94 | 67.18 | 66.11 | 58.44 |
| Capitalization at the end of the period (PLN m) | 45,416 | 54,354 | 58,015 | 57,091 | 50,468 |
Source: www.gpwinfostrefa.pl, Company
PZU’s stock-related statistics
| PZU’s stock-related statistics | 2016 | 2017 | 2018 | 2019 | 2020 |
| Maximum price (PLN) | 36.3 | 49.06 | 47.34 | 45.39 | 41.80 |
| Minimum price (PLN) | 24.38 | 32.82 | 36.31 | 35.79 | 20.55 |
| Closing price on the last trading session of the year (PLN) | 33.21 | 42.16 | 43.90 | 40.03 | 32.36 |
| Average session price (PLN) | 30.76 | 42.53 | 41.48 | 40.61 | 30.06 |
| Trading volume (PLN m) | 16,755 | 18,902 | 17,183 | 16,620 | 17,588 |
| Average turnover per session (PLN m) | 66.8 | 75.6 | 69.6 | 67.0 | 69.8 |
| Number of transactions (units) | 1,046,398 | 985,515 | 926,486 | 928,493 | 1,523,449 |
| Average number of trades per session | 4,169 | 3,942 | 3,751 | 3,744 | 6,045 |
| Trading volume (units) | 558,496,833 | 448,832,864 | 415,380,500 | 408,999,167 | 595,296,291 |
| Average trading volume per session (shares) | 2,225,087 | 1,795,331 | 1,681,702 | 1,649,190 | 2,362,287 |
| Capitalization at the end of the period (PLN m) | 28,77 | 36,406 | 37,908 | 34,567 | 27,944 |
Source: www.gpwinfostrefa.pl
PZU’s stock*
| PZU’s stock* | 2016 | 2017 | 2018 | 2019 | 2020 |
| P/BV (Price to Book Value) Share price / book value per share |
2.2x | 2.6x | 2.5x | 2.1x | 1.5x |
| BVPS (PLN) Book value per share |
15.0 | 16.3 | 17.3 | 18.7 | 21.7 |
| P/E (Price to Earnings) Share price / net earnings per share |
14.8x | 12.6x | 11.8x | 10.5x | 14.6x |
| EPS (Earnings Per Share) (PLN) Net profit (loss) / number of shares |
2.2 | 3.4 | 3.7 | 3.8 | 2.2 |
* Calculation based on the PZU Group’s data (according to IFRS); price per share and book value at yearend; net profit for 12 months; number of PZU shares: 863,523,000
PZU’s valuation versus its peer group (P/BV and ROE) 2020
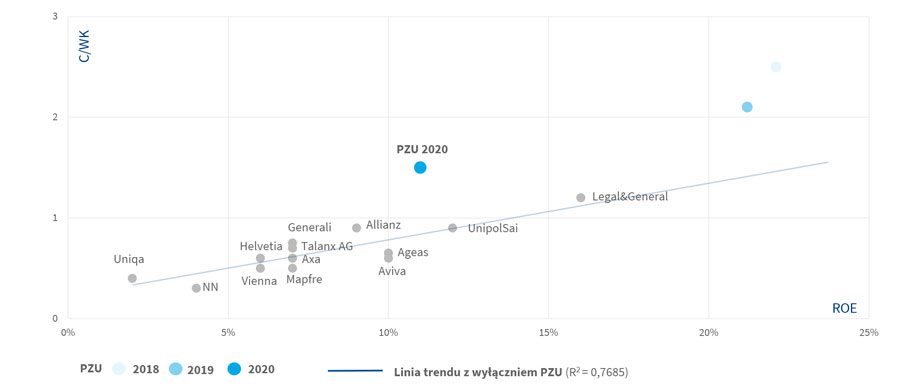
Source: PZU (2018, 2019, 2020) – reported data; other companies – 2020 annual forecasts (Bloomberg); PZU share prices at year-end 2020
1 WIG20 is a price index, meaning that it is calculated by using only the prices of the transactions related to it, without incorporating dividend income
2 In accordance with the methodology applied by Stooq (http://stooq.pl/ pomoc/?q=9&s=pzu)
